Thursday, December 6, 2018

Declarative IT and Design for Operations

Was reading a very insightful and interesting blog from @TorstenVolt on Linked.in titled "Digital Transformation Requires Autonomic Computing 3.0" and started to see some commonality in the needed operations processes with a digital future.

This, by the way, is right after @AWS announces their AWS Outposts, a telling example of how coevolution in IT validates concepts and models (Yes, everyone, Hybrid is real, even Microsoft things so) and how terribly important it is to get to the data.

Torsten brings up some very important points about post transformational examples on what direction needs to take place.  It's very much like the conversation that @cpswan brings up almost every time we talk, how does the future solve the problems we see through Design for Operations.

The solution for Design for Operations revolves distinctly around Declarative IT plus a bit of truth and trust in the platform(s) associated with that same delivery.

I've done my best in capturing/mapping this in a Wardley Map as a way to illustrate the idea.

Declarative needs and Design for Operations of IT Infrastructure
Figure 1.  Wardley Map showing Declarative needs and Design for Operations of IT Infrastructure
In general, IT Infrastructure Design for Operations includes a Platform for management of Declarative states of underlying infrastructure.

With the abstraction of server virtualization and cloud computing, the declarations became very much least common denominator and not very permissible with respect the evolution of application development (the Dev part of DevOps).  It eased operations of the abstracted layer considerably, but it didn't really enhance the Ops side of the infrastructure model.

At this point, we could argue that the Cloud Titans have already achieved a more horizontally evolved Declarative Platform, but now that everyone seems to be reaching back into the Enterprise Datacenter, permissible use and least common denominator may very well come into play again.

So, looking at the problem that now needs to be solved, truly Declarative Storage and Declarative Compute need to be pressed into evolution toward commodity to achieve the rewards of application integrated software definition of the hybrid datacenter.

This should go a long way toward solving the Design for Operations problems as well as matching up with @TorstonVolt's re-conceptualization of the Digital future state.


Friday, November 30, 2018

Wardley Mapping Technical Debt of a System

A friend of mine brought a question, can you map technical debt of a neglected system (edited) with Wardley Mapping.

I'm not sure it's possible in a single slide, mostly because the Wardley Map would require a time axis (or even a worker knowledge axis) to depict it in one slide.

To explain the entire idea, I'm going to use 8 slides such that the entire thought may be followed.  Please keep in mind, that this is entirely theoretical in nature.

For starters, Wardley Maps does have a couple of mechanisms that are useful for this depiction (See Figure 1 upper right).  The first one is inertia, represented as a solid bar and the second is a fat arrow indicating acceleration and deacceleration.

Figure 1 is a starting value chain map, with a system between the electricity anchored in the Commodity (+utility) area and a user need indicated in the most visible position.

Figure 1.  Wardley Map of system with Inertial marker identified

I'm placing the characteristic of Inertia in the middle of the system, with the supposition that there are no other forces acting on the system (like in physics).

Let's suppose then, that a deaccelertion is applied to the system by forgoing a technical upgrade in a part or all of the system.  See Figure 2.

Figure 2.  Stalling Update of System to N-1
This will impose an inertial movement from current position to the left.  See Figure 3.  Also note the "shadow" of Technical Debt in this drawing behind the system's inertial reference.
Figure 3.  System in N-1 State
The system is still within the Product (+rental) space and therefore there is no significant harm to how the system provides for the user need.

Imparting another deacceleration to the center mass of the system by forgoing the next generational needs of upgrading the system again shifts the center of mass of the system to the left.  See Figure 4.

Figure 4.  Forgoing update of system to N-2
See Figure 5, the system now sits on a precarious boundary between Product and Custom.  The possibility that the functions of support and management are greatly increased and the system itself may need some parts of its structure custom maintained.  The "shadow" of Technical Debt has grown with respect to the movement of the system.

Figure 5.  System in precarious boundary between Product and Custom


Forgoing another generational upgrade of the system imparts another deacceleration to the overall system.  See Figure 6.


Figure 6.  Further neglect of System to N-X


Continuous neglect of the system eventually leads to complete failure, where the massive "shadow" of Technical Debt of this neglect leads to system collapse through the technological inability to upgrade or loss of knowledge necessary to upgrade. See Figures 7 and 8.

Figure 7.  Continued neglect until system breaks
Figure 8.  Broken system (fully in Genesis) with Total of Technical Debt
Once the center of mass passes the Genesis boundary, the system is likely incapable of accurate function.  The user needs will no longer be met and that also may need to shift along with the center of system inertial movement or more likely be removed altogether.

As always, if you've any additional thoughts on this topic, I'm active in the twitter-verse @abusedbits

https://threadreaderapp.com/thread/1068822023126827010.html

Friday, July 6, 2018

Evolving a Business Process with a Wardley Map, Part 2

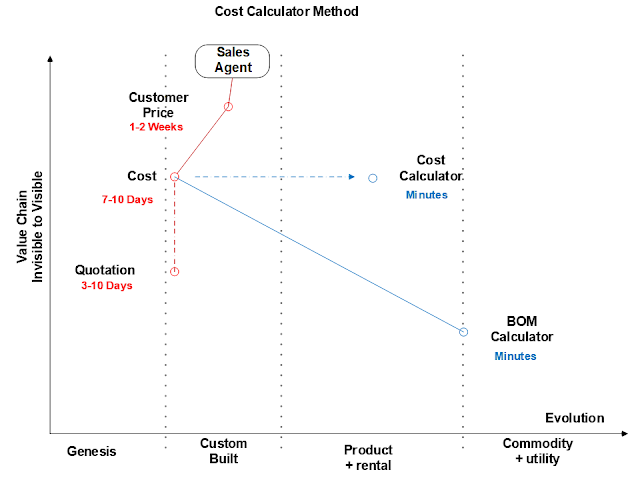
Following on from Evolving a Business Process with a Wardley Map, we were discussing the Cost mechanism.

The question was, if we understand the BOM, "Can we get to ROM Cost quicker?"

@swardley, Business, Costing, Map, mapping, Maps, Pricing, Wardley, WardleyMaps,
5. Cost Calculator
This part of the evolution of the business process is actually more difficult.  It involves having ALL of the partner/vendors willing and able to work with you to create a Cost Calculator.

The good thing, if it is possible to create a BOM Calculator, most of the business logic is understood well enough to introduce the concept of Cost with the same (or similar) business logic.  The reverse is also true, we just needed a starting point.

In Figure 5, we're evolving a Cost Calculator as a product of the BOM Calculator output.  It is most assuredly in the Product category because it requires a product like update on a regular interval with the partner/vendor to maintain currency with their cost changes.

In Figure 6, we've created the new Cost method.

6. New Cost Method
The benefit of this change in process, we've shaved an additional 7-10 days off the Process.  We're also able to discuss pricing with a real BOM and a tolerance based Cost.

The problem, it is unlikely to be as exact as the Quotation step, but fine for ROM review. Providing we can live with small fluctuation between the Cost Calculator and the Quotation, everything should be fine.  Just make absolutely sure you understand completely the cost tolerance requirements.

7. Optimization Method
There's quite a good chance, especially with a mixed product-service opportunity, that there is potentially an unacceptable variation to the required tolerance without looking at Optimization of the BOM to ROM, Figure 7.

The Question for the Cost Calculator, "Is 1 large widget more cost effective than 2 medium widgets or even 4 small widgets?"

Consider the scenario where the product is a combination of labor, hardware and software licensing.  Optimization of the Calculators (a Calculator of Calculators, if you will) provides the means to create a deeper awareness of the product as well as a mechanism for Sizing appropriately for the need with cost in mind.

8. New ROM and BOM tool
We then shift our attention to Customer Pricing.

The Question, "Can we get to Customer Price quicker with better awareness?"

In the mapping exercise, we could very well have started with this question as it would be the most customer centric pursuit.  I'm not entirely sure it would have changed the path we followed, but I'm relatively certain it would have been a more daunting starting point.

9. New Costing and Pricing Method

It's obvious that a Calculator for pricing solves this problem the most expediently.

At this point, we've achieved the knowledge necessary to create calculators for the change in process steps.  We can also use those calculators to feed the Quotation requirements, potentially shortening that process step in Final Pricing.

The big win, we've moved the Sales Agent's view of the process from Custom Build to Product and improved his time to respond to the customer.

The overall process, from start to finish goes like this:

Customer Input -> ROM and BOM Calculator (as many times as Customer Input changes) -> Feed the Sizing from the ROM and BOM Calculator to Quotation -> Run the Quotation(s) through the Pricing Tool -> Sales Agent happiness

This Wardley Mapping exercise ended up being mostly about convenience, a bit about standardization.  How do you execute an On-Demand set of actions that would normally take between 22 and 44 days, in the shortest time possible?

As always, I'm interested in your feedback.  Find me on Twitter @abusedbits

Friday, June 29, 2018

Evolving a Business Process with a Wardley Map

Wardley Mapping (Value Chain Mapping) can be a great asset in describing the evolution of a business process.  In this case, I'm going to illustrate the changes of the Costing and Pricing action to show how improvements may be identified once the current or base activity is mapped.

In this scenario, Costing and Pricing, a sales agent needs to arrive at a Price for the customer.

The process includes engagement of a high skill technical person to create a Bill of Materials (BOM) for the customer.

It requires a Quotation that includes all of the BOM items, this is then used to create a Cost.

The Costs are then all rolled up, margin/cost-of-money and services/labor are included to create Customer Price in such a way that the Sales Agent may have a Rough Order of Magnitude (ROM) conversation with the Customer.

Here's what that map looks like.

@swardley, WardleyMaps, Wardley, Maps, Map, mapping, Business, Costing, Pricing
1.  Costing and Pricing Activity
Keeping in mind that Wardley Map placement is relative, BOM activity is in the Genesis category primarily because "we know very little" about the customer desire until a BOM is generated to discuss and modify to the customer requirements.

Quotation is in Custom Build, because it is generated uniquely based on the BOM for the customer.  It is subject to change, also based on customer requirements.

The same can be said for Cost and Customer Price.  Without a customer qualified BOM, the entire process flow is subject to correction and reset until that action is completed.

The Question to ask, "Can we move this process to Product or Utility?"

2.  Optimize the BOM activity
Any one of the items in the process flow could be looked at for possible improvement.  In determining where to start, sometimes it is just picking a point and mapping out possible evolution steps and see what happens to the map.

In this case, we're looking at the BOM, if for no other reason than it feeds the more visible aspects of the value chain.

The Question for BOM, "Can we improve the BOM by creating a calculator for the BOM?"

There are some implications to this question, the principle one, can we create a standard method.  The standard method would be an idealization of the Bill of Materials in such a way that changes to it became mathematical multiples of or well understood relationships between the elements.  This implies a standard and baseline awareness of a design or architecture that at the very smallest level that consists of units that can be both measured and used as incremental building blocks.

3. New BOM Method
  In the case where that is true, the Bill of Materials Calculator (figure 3) can potentially replace the BOM action in Genesis.  Utilizing well understood units of measure, the calculator makes it possible to manipulate the BOM output to the customer desired goals/end-state much more rapidly.  The output of this tooling is arguably a utility in nature, but because it continues to rely on manual understanding/input, we'll put it squarely on the product/utility line.

The benefit of this change in process, we've shaved 7-14 days off the Process.

The Question for BOM Calculator, "How important is the Quotation?"

As it turns out, the Quotation with the source suppliers is only required when finalizing a deal with the customer.  So, as figure 4 indicates, we're going to skip over Quotation and start to consider the Cost analysis.  Because supply chain / purchasing requires the Quotation, we cannot remove it from the process, but it doesn't have to be done until we're in a position to make a purchase.


4.  Quotation
With Quotation removed (for the moment), and a good awareness of the BOM sizing activity we'll tie the BOM directly to the Costing activity.

The benefit of this change in process, we don't have to Quote each an every time we need to understand a Rough Order of Magnitude (ROM) cost.

The Question for the BOM Calculator mechanism then becomes, "Can we get to ROM cost quicker if we understand the BOM?"

In the next installment, I'll review how Costing evolves to improve the process.

Wednesday, April 25, 2018

Getting to the New Problems

At some point in the evolution of a product, a new product will come along and displace it.  Examples are quite prolific in IT, exactly like what happened with video rental, the entire market was replaced.

In the Settlers and New Problem entry, I made what turned out to be an abortive attempt at rationalizing this within the context of the Value Chain.  It should have been in an Evolution Map, as in Descriptive Evolution Mapping.

There still exists the issue of identifying new problems to be solved that create the displacement.  It can happen almost anywhere on the continuum of the product.  It's my feeling that it is the most identifiable and the most "felt" when the product being displaced is at the assumed stage of "Solutions to Known Problems" or "Refinement of Solutions."  That in mind, it can happen at any stage.

The following Wardley Map shows the associated change from the perspective of a Value Chain map.  It's also how, in "Next IT Shift, back to Distributed", the step function that could be used to show a possible future is realized.

The example, in "Next IT Shift, back to Distributed", implies that Cloud Computing is perpetually in a state of Refinement of Solution, but "Sensors, IoT and Machine Learning" cannot all be run from Cloud Computing:  This is the New Problem How do you get data to where it needs to be acted on with an enormously distributed system?  Should we try to move data in this way?
@swardley, WardleyMaps, Wardley, Maps, mapping, Evolution,
Getting to the New Problems

Tuesday, April 17, 2018

Descriptive Evolution Mapping

Thanks to @swardley and the community for steering me to a better definition of the Wardley Maps I was attempting to produce.

Wardley Map Evolution
Wardley Maps - Evolution Map

The graphic above introduces the product view of each phase of Design.

As a starting point, it is the output of the workload or application that has value.

The applications, and indeed the early computers, were Designed for Purpose.  They were also Custom built.  This is illustrated by the simple fact that repurposing an early computer may very well mean that the equipment necessary to run a different program may have to be changed in some pretty fundamental ways.

     Evolution of computing lead to computers that were capable of multi-purpose computing.  The applications were no longer specifically tied to hardware that they operated on (I know there's an argument brewing here, but it's the generalization I'm illustrating).

This provided the means for individuals and companies to run a multitude of programs on computing equipment.  This was a generational improvement in application development and lead to an entire industry of boxed software delivery.

     The box software products were developed within the framework of a particular operating system with guidelines about what and how commands were processed.  This is a manufacturing guideline and therefore we can identify the boxed software industry as Design for Manufacture and each "box" contained a Product on some type of media.

     Interestingly, the Product area is not necessarily the valuable output of the workload or application, but a means integrated to produce the valuable output.  This means that, while boxed software may very well be a Product, the overall application may still be Custom build, retroactively putting the entirety of said application back into Design for Purpose.

     Another interesting tidbit, the tight control over box software lead to the creation of competitors and the OpenSource industry.  This happened because the design of the overall application mandated variation that the box software vendors were either unwilling or unable to easily produce or it came at great licensing expense.

We reach another evolutionary state with what are arguably extremely easy to consume application outputs.  Built specifically with the consumer in mind and creating a service category (Utility Service) built upon commodity components. These are more easily offered in a volume consumption model of cost/volume-time.

     Utility specifically targets ease of consumption, foremost the usage mechanisms or operation.  It therefore represents a Design for Operations method of delivery.  Constantly being updated and firmly rooted in the idea that the easier it is to use, the more difficult it will be to replace.

     An interesting consequence of Design for Operations is that competitive pressures in Utility drive new business practices like Business Agility/Agile DevOps.

What's next you might ask?  google serverless, then google codeless


Friday, April 6, 2018

Settlers and the New Problems

There are some fundamental truths that drive technology forward, not meaning to be entirely inclusive, but they certainly include

     Technology evolves on top of other technology advancements
     Technology needs to be simplified or abstracted away from complexity to advance

This leads to interesting side cases of where the interdependence of technology must co-evolve with a relatively uncertain future state to continue moving forward.  Part of the solution is an evolution on top of the old technology and part of the solution is an abstraction to solve a complexity problem.

There are also characteristics of technology that meet as part of an industrialization of the technology.  Chris Swan @cpswan speaks on this very elegantly in the move from a technology that is design for operations rather than a design for manufacture or the design for purpose.

Industrialization of this sort is a stepping stone, much like the technology changes that move the state of the art from Town Planners back to Genesis and Design for Purpose.

Wardley Map Settlers and the New Problem
Settlers and the New Problem
Here's the diagram I'm using to try to illustrate this effect.  It is loosely based on the Wardley Map of  Settlers and an evolution step function that shows the evolution toward the "New Problems."

Looking forward to your feedback!

Update Apr 9:


Which lead to this:


and then this: